
Diagnosing HTML or CSS problems
One of the easiest and most effective ways to diagnose and identify CSS issues is to use either the Internet Explorer Developer Tools (IE8 or higher), Mozilla Firefox browser with Firebug enabled or the built in Developer Tools in Google Chrome. Those tools allow you to inspect in detail the generated HTML and identify which style rules are contributing to the layout and style of a given part of the page.
Using the Developer Tools in Google Chrome
Google Chrome can be downloaded here: www.google.com/chrome
Build the output you would like to inspect. Once built, open the pure HTML output in Chrome.
- Within the Table of Contents navigate to a Topic you would like to inspect the CSS or HTML for.
- Press Ctrl+Shift+I to open the Developer Tools.
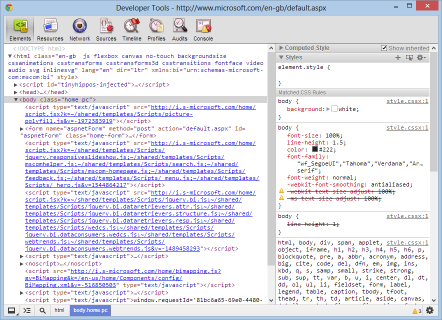
- The strip of buttons at the top of the Developer Tools pane allows you to inspect various aspects of the page.
- Click on the Elements button to show the element hierarchy.
- Click the magnifying glass icon on the strip at the bottom of the Developer Tools pane - this activates Inspect mode.
- Move your mouse over the page and click an element you are interested in looking at more closely.
- The Developer Tools will now show, down the right hand edge of the Developer Tools pane, the various style rules that are being applied to that element (example below)
Using Firebug in Mozilla Firefox
Firefox can be downloaded here: Mozilla
Once Firefox is installed use the Add-ons button from the Firefox application menu to open the Add-ons page. Type "firebug" in the Search all add-onsbox at the top of the page. Install the Firebug Add-on.
Build the output you would like to inspect. Once built, open the pure HTML output in Firefox.
- Within the Table of Contents navigate to a Topic you would like to inspect the CSS or HTML for.
- Using the Tools menu select Firebug>Open Firebug (If Firebug is disabled then enable using the enable Firebug and the Enable for local files links).
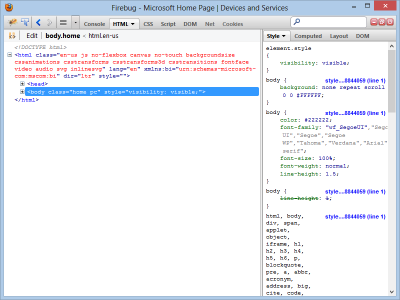
- Click on the tab that relates to the type of script you are inspecting (e.g CSS).
- Click on the Inspect button.
- Move cursor over the Web page being viewed and note how the selected contents associated CSS/HTML is displayed (example below).
You can find more information about using Firebug on the Firebug Home Page.
Using the Developer Tools in Internet Explorer
Build the output you would like to inspect. Once built, open the pure HTML output in Internet Explorer.
- Within the Table of Contents navigate to a Topic you would like to inspect the CSS or HTML for.
- Press F12 to open the Developer Tools window.
- Click the cursor toolbar button to start Inspect mode.
- Click on the element that you want to inspect.
- The developer tools will highlight the element you clicked in the element hierarchy and will show the style rules that are in effect for that element on the right hand side (example below).

You can find more information about using the Internet Explorer Development Tools on the How to use F12 Developer Tools to debug your Webpages MSDN page.